[BoTo] Pump&Dump StrategyThis strategy uses only long positions. It isn't used short positions, it doesn't use marginal trade, it doesn't use a pyramiding.
It is strategy uses only one indicator. Ourselves have constructed the indicator for cryptocurrencies. We called it 'Pump&Dump Ocsilator'. You can read as this indicator works here:
Not usual stop
Strategy uses 2 ways for closing of an unprofitable position. But it is possible to use only one way.
Way 1: if the indicator has distinguished a dump, then the long position needs to be closed when the candle is closed (for an example: to close a position when time 00:00 if you have chosen daily timeframe)
Way 2: the user himself chooses the size in settings of this script. Percent. If the user has chosen 100%, means isn't used absolutely. Because the price will never fall by 100%. If the user has chosen less than 100%, for example 5%, then the long position needs to be closed if the low of a candle was less than this price level of choosed stop-loss. But the position needs to be closed too when the candle is closed.
Strategy
A pump-signal: if the candle green and her body is 3 times more than norm
A dump-signal: on the contrary, if the candle red and her body is 3 times more than norm
For opening of a long position: it is necessary any pump-signal (if the position hasn't been open yet)
For closing of a long position: several ways:
1) Or any dump-signal is necessary
2) Or a stop-loss which was chosen by the user is necessary
Cari dalam skrip untuk "stop loss"

Millionare tool1. No lag, proprietary algorithm gives signal when position is triggered.
2. Ideal for ones who have tight stop losses but book profits very soon and miss the BIG move.
3. Works on Intraday/ positional/investment long term
4. Works on INDEX/ EQUITY/ FOREX/ CRYPTO CURRENCY
5. Works in any market all over the world, USA,LONDON, JAPAN,INDIA etc
6. 5d,1m,3m ,6m,1yr,5yr no problem.
7. Ideal for trend traders who want to catch the biggest move
8. All human emotions/temptations, silly indicators are out, get the signal? take the entry. simple as ABC
9.Use a breakeven stop loss or max 0.3%, never have a big loss, only big profits
*BUY on long signal, book profits when content, or on next short signal, can initiate fresh shorts too.
*Works in all markets mentioned
*Its your best friend to catch the trend. money
Some examples-
1) postimg.org
2) postimg.org
3) postimg.org
4) postimg.org
5) postimg.org

MACDouble & StochRSI w/ safeties and variable time interval v0.3UPDATE:
IMPORTANT!!! MAKE SURE "RECALCULATE AFTER ORDER FILLED" IS CHECKED. I will have it on by default in the future.
This is a continuation of my previous scripts of two MACD indicators with a Stochastic RSI indicator.
New features:
- Alternate MACD time interval
You can now set the time interval for the second MACD indicator to a different resolution than the displayed chart.
Uncheck the box and select the desired interval. For example, if your chart is set to 15min then first MACD will be set at 15 min and you can select 5 min for the second MACD.
- Alternate StoRSI time interval
You can (and should) set the StochRSI to a different time interval as well. StochRSI hasn't worked great with previous versions. Now you can set it to a different time resolution as well. I strongly recommend you set it at a higher (slower) resolution; for example if your chart is set at 15min then you should test setting the StochRSI at 30 or 45min.
- ' True" StochRSI logic
Trading logic for StochRSI is now a true StochRSI, instead of just reading "k" and ignoring "d", K now has to be greater than D to buy and less than to sell.
- Safeties
A primitive but low risk safety in the form of an uptrend/downtrend price safety. If current close+high isn't greater than the previous close and high then the buy order will not be executed. The same applies for sell orders.
- Cap on losses from short positions
A stop loss safety set to 9000 for exiting sell positions. This will need refinement in the future but this puts a cap on losses from any sell position. At an initial currency of 10,000 this translates to 90.00. If it is giving you problems simply delete line 78 from the source code.
Please feel free to ask any questions or send me suggestions. This is still very much a work in progress and I'll try to polish up the rough spots but it is fully functional. With a slower StochRSI and the safeties I have gotten it to consistently outperform the old 2x MACD strategy script---typically by 3-fold.

VWolf - Shadow PulseOVERVIEW
The Trend Momentum Breakout Strategy is a rule-based trading system designed to identify high-probability entries in trending markets using a combination of trend confirmation, momentum filtering, and precise trigger conditions. The strategy is suitable for intermediate to advanced traders who prefer mechanical systems with clear entry/exit logic and configurable risk management options.
At its core, this strategy seeks to enter pullbacks within strong trends, capitalizing on momentum continuation after brief pauses in price movement. By integrating multiple moving averages (MAs) for trend validation, ADX (Average Directional Index) as a strength filter, and Stochastic RSI as an entry trigger, the strategy filters out weak trends and avoids overextended market conditions. Exit logic is based on a customizable fixed stop-loss (SL) and take-profit (TP) framework, with optional dynamic risk-reduction mechanisms powered by the Supertrend indicator.
This strategy is designed to perform best in clearly trending markets and is especially effective in avoiding false breakouts or choppy sideways action thanks to its ADX-based filtering. It can be deployed across a variety of asset classes, including forex, stocks, cryptocurrencies, and indices, and is optimized for intra-day to swing trading timeframes.
RECOMMENDED USE
This strategy is designed to be flexible across multiple markets, but it performs best under certain conditions:
Best Suited For:
Trending markets with clear directional momentum.
High-volume instruments that avoid erratic price action.
Assets with intraday volatility and swing patterns.
Recommended Asset Classes:
Forex pairs (e.g., EUR/USD, GBP/JPY)
Cryptocurrencies (e.g., BTC/USD, ETH/USDT)
Major indices (e.g., S&P 500, NASDAQ, DAX)
Large-cap stocks (especially those with consistent liquidity)
Suggested Timeframes:
15-minute to 1-hour charts for intraday setups.
4-hour and daily charts for swing trading.
Lower timeframes (1–5 min) may generate too much noise unless fine-tuned.
Market Conditions to Avoid:
Ranging or sideways markets with low ADX values.
Assets with irregular price structures or low liquidity.
News-heavy periods with unpredictable price spikes.
CONCLUSION
This strategy stands out for its robust and modular approach to trend-following trading, offering a high level of customization while maintaining clear logic and structural discipline in entries and exits. By combining three distinct layers of confirmation—trend identification (via configurable moving averages), trend strength validation (via the DMI filter), and timing (via the Stochastic RSI trigger)—it aims to reduce noise and increase the probability of entering trades with directional bias and momentum on its side.
Its flexibility is one of its strongest points: users can tailor the strategy to fit various trading styles and market conditions. Whether the trader prefers conservative setups using only the slowest moving average, or more aggressive entries requiring full alignment of fast, medium, and slow MAs, the system adjusts accordingly. Likewise, exit management offers both static and dynamic methods—such as ATR-based stop losses, Supertrend-based adaptive exits, and partial profit-taking mechanisms—allowing risk to be managed with precision.
This makes the strategy particularly suitable for trend-driven markets, such as major currency pairs, indices, or volatile stocks that demonstrate clear directional moves. It is not ideal for sideways or choppy markets, where multiple filters may reduce the number of trades or result in whipsaws.
From a practical standpoint, the strategy also incorporates real-world trading mechanics, like time-based filters and account risk control, which elevate it from a purely theoretical model to a more execution-ready system.
In summary, this is a well-structured, modular trend strategy ideal for intermediate to advanced traders who want to maintain control over their system parameters while still benefiting from layered signal confirmation. With proper calibration, it has the potential to become a reliable tool in any trader’s arsenal—particularly in markets where trends emerge clearly and sustainably.
FOR MORE INFORMATION VISIT vwolftrading.com

S&D Light+ Enhanced# S&D Light+ Enhanced - Supply & Demand Zone Trading Strategy
## 📊 Overview
**S&D Light+ Enhanced** is an advanced Supply and Demand zone identification and trading strategy that combines institutional order flow concepts with smart money techniques. This strategy automatically identifies high-probability reversal zones based on Break of Structure (BOS), momentum analysis, and first retest principles.
## 🎯 Key Features
### Smart Zone Detection
- **Automatic Supply & Demand Zone Identification** - Detects institutional zones where price is likely to react
- **Multi-Candle Momentum Analysis** - Validates zones with configurable momentum requirements
- **Break of Structure (BOS) Confirmation** - Ensures zones are created only after significant structure breaks
- **Quality Filters** - Minimum zone size and ATR-based filtering to eliminate weak zones
### Advanced Zone Management
- **Customizable Zone Display** - Choose between Geometric or Volume-Weighted midlines
- **First Retest Logic** - Option to trade only the first touch of each zone for higher probability setups
- **Zone Capacity Control** - Maintains a clean chart by limiting stored zones per type
- **Visual Zone Status** - Automatically marks consumed zones with faded midlines
### Risk Management
- **Dynamic Stop Loss** - Positioned beyond zone boundaries with adjustable buffer
- **Risk-Reward Ratio Control** - Customizable R:R for consistent risk management
- **Entry Spacing** - Minimum bars between signals prevents overtrading
- **Position Sizing** - Built-in percentage of equity allocation
## 🔧 How It Works
### Zone Creation Logic
**Supply Zones (Selling Pressure):**
1. Strong momentum downward movement (configurable body-to-range ratio)
2. Identified bullish base candle (where institutions accumulated shorts)
3. Break of Structure downward (price breaks below recent swing low)
4. Zone created at the base candle's high/low range
**Demand Zones (Buying Pressure):**
1. Strong momentum upward movement
2. Identified bearish base candle (where institutions accumulated longs)
3. Break of Structure upward (price breaks above recent swing high)
4. Zone created at the base candle's high/low range
### Entry Conditions
**Long Entry:**
- Price retests a demand zone (touches top of zone)
- Rejection confirmed (close above zone)
- Zone hasn't been used (if "first retest only" enabled)
- Minimum bars since last entry respected
**Short Entry:**
- Price retests a supply zone (touches bottom of zone)
- Rejection confirmed (close below zone)
- Zone hasn't been used (if "first retest only" enabled)
- Minimum bars since last entry respected
## ⚙️ Customizable Parameters
### Display Settings
- **Show Zones** - Toggle zone visualization on/off
- **Max Stored Zones** - Control number of active zones (1-50 per type)
- **Color Customization** - Adjust supply/demand colors and transparency
### Zone Quality Filters
- **Momentum Body Fraction** - Minimum body size for momentum candles (0.1-0.9)
- **Min Momentum Candles** - Number of consecutive momentum candles required (1-5)
- **Big Candle Body Fraction** - Alternative single-candle momentum threshold (0.5-0.95)
- **Min Zone Size %** - Minimum zone height as percentage of price (0.01-5.0%)
### BOS Configuration
- **Swing Length** - Lookback period for structure identification (3-20)
- **ATR Length** - Period for volatility measurement (1-50)
- **BOS Required Break** - ATR multiplier for valid structure break (0.1-3.0)
### Midline Options
- **None** - No midline displayed
- **Geometric** - Simple average of zone top/bottom
- **CenterVolume** - Volume-weighted center based on highest volume bar in window
### Risk Management
- **SL Buffer %** - Additional space beyond zone boundary (0-5%)
- **Take Profit RR** - Risk-reward ratio for target placement (0.5-10x)
### Entry Rules
- **Only 1st Retest per Zone** - Trade zones only once for higher quality
- **Min Bars Between Entries** - Prevent overtrading (1-20 bars)
## 📈 Recommended Settings
### Conservative (Lower Frequency, Higher Quality)
```
Momentum Body Fraction: 0.30
Min Momentum Candles: 2-3
BOS Required Break: 0.8-1.0
Min Zone Size: 0.15-0.20%
Only 1st Retest: Enabled
```
### Balanced (Default)
```
Momentum Body Fraction: 0.28
Min Momentum Candles: 2
BOS Required Break: 0.7
Min Zone Size: 0.12%
Only 1st Retest: Enabled
```
### Aggressive (Higher Frequency, More Signals)
```
Momentum Body Fraction: 0.20-0.25
Min Momentum Candles: 1-2
BOS Required Break: 0.4-0.5
Min Zone Size: 0.08-0.10%
Only 1st Retest: Disabled
```
## 🎨 Visual Elements
- **Red Boxes** - Supply zones (potential selling areas)
- **Green Boxes** - Demand zones (potential buying areas)
- **Dotted Midlines** - Center of each zone (fades when zone is used)
- **Debug Triangles** - Shows when zone creation conditions are met
- Red triangle down = Supply zone created
- Green triangle up = Demand zone created
## 📊 Best Practices
1. **Use on Higher Timeframes** - 1H, 4H, and Daily charts work best for institutional zones
2. **Combine with Trend** - Trade zones in direction of overall market structure
3. **Wait for Confirmation** - Don't enter immediately at zone touch; wait for rejection
4. **Adjust for Market Volatility** - Increase BOS multiplier in choppy markets
5. **Monitor Zone Quality** - Fresh zones typically have higher success rates
6. **Backtest Your Settings** - Optimize parameters for your specific market and timeframe
## ⚠️ Risk Disclaimer
This strategy is for educational and informational purposes only. Past performance does not guarantee future results. Always:
- Use proper position sizing
- Set appropriate stop losses
- Test thoroughly before live trading
- Consider market conditions and overall trend
- Never risk more than you can afford to lose
## 🔍 Data Window Information
The strategy provides real-time metrics visible in the data window:
- Supply Zones Count
- Demand Zones Count
- ATR Value
- Momentum Signals (Up/Down)
- BOS Signals (Up/Down)
## 📝 Version History
**v1.0 - Enhanced Edition**
- Improved BOS detection logic
- Extended base candle search range
- Added comprehensive input validation
- Enhanced visual feedback system
- Robust array bounds checking
- Debug signals for troubleshooting
## 💡 Tips for Optimization
- **Trending Markets**: Lower momentum requirements, tighter BOS filters
- **Ranging Markets**: Increase zone size minimum, enable first retest only
- **Volatile Assets**: Increase ATR multiplier and SL buffer
- **Lower Timeframes**: Reduce swing length, increase min bars between entries
- **Higher Timeframes**: Increase swing length, relax momentum requirements
---
**Created with focus on institutional order flow, smart money concepts, and practical risk management.**
*Happy Trading! 📈*

Inyerneck Quiet Bottom Hunter v36 — Last Sorta-Working VersionQuiet Bottom Hunter v36 — Accurate Description (the sorta-working version that fires signals)
Overview
A mean-reversion bottom-hunting strategy for small-cap stocks (<$2B market cap). Designed to catch slow-bleed stocks that quietly bottom out and rebound 20–60%+. Good for beginners because signals are infrequent and the setup is easy to understand.
Timeframe
Daily (D) — best results on 1-day charts. Works on weekly too, but signals are rarer.
Triggers / Conditions (all must be true at bar close)
Drop from high ≥ 25% from the highest high in the last 100 bars (previous bars only — no repainting)
Volume ≤ 80% of the 50-day average (quiet accumulation, no panic selling left)
RSI(14) ≤ 38 (oversold territory)
Green/flat streak ≥ 2 consecutive days where close ≥ open (shows sellers are exhausted)
When all four line up → tiny green “QB” triangle below the bar
Firing Frequency
1–4 signals per month on an average small-cap stock (depends on market conditions). Some months zero, some months a handful. Not spammy, but not ultra-rare either.
Usage Parameters
Position size: 10% of equity per trade (default — change to 5–20% depending on risk tolerance)
Profit target: 40%
Stop loss: 12%
Hold time: usually 2–8 weeks
Best on low-float, high-volatility small caps (TLRY, SNDL, MVIS, SOUN, INHD, etc.)
Expected Performance (backtested on 2025 small caps)
Win rate: ~80–85%
Average rebound on winners: +30–40%
Some losers when the bottom isn't "quiet" enough
How to use
Add to daily charts of your small-cap watchlist
When “QB” arrow appears, buy at next open or market
Set 40% target / 12% stop or trail it
Wait for the rebound — no day-trading needed

Triple Screen Scalper [Pro] + Dynamic Risk Engine + Smart DCA🚀 Strategy Concept
This algorithm utilizes a Triple Screen methodology to filter market noise and align trades with the path of least resistance. Instead of relying on a single timeframe, it analyzes market structure across three distinct "horizons" to ensure high-probability execution:
The Tide (Long-Term): Analyzes the dominant directional flow and market bias on higher timeframes.
The Wave (Medium-Term): Measures the strength of the current momentum and pauses trading during weak or "choppy" market phases.
The Ripple (Short-Term): Pinpoints precise entry zones by detecting over-extended price action and mean-reversion opportunities within the larger trend.
The system is fortified with a Smart DCA (Dollar Cost Averaging) Engine that adapts to volatility. It does not blindly add to positions; it calculates "Risk Room" and "Trend Stability" before every additional entry, ensuring capital is deployed efficiently rather than recklessly.
⚙️ Configuration Guide (Variable Explanations)
💰 Position & Leverage
Trade Direction: Choose between Long, Short, or Auto. In "Auto," the system trades both directions based on the dominant trend.
Target Entry Leverage (x): The desired leverage for your initial entry.
Base Order Size (% of Equity): How much of your account balance is allocated to the very first trade of a sequence.
DCA Size Multiplier: Controls how much larger each subsequent order is compared to the previous one. A value of 1.0 means flat sizing; values above 1.0 increase the size of recovery orders.
KILL SWITCH: Max Effective Lev: A safety ceiling. If your total position's effective leverage exceeds this value, the strategy will force-close the position to prevent liquidation.
🚀 Profit Settings (Dynamic Exits)
Use Dynamic Profit?: If enabled, the take-profit target acts like a breathing lung—expanding during high volatility (to catch bigger moves) and contracting during quiet periods.
Gain Volatility Length: The lookback period used to measure recent market volatility.
Gain Multiplier: Scales the profit target. Higher numbers require a larger price move to hit profit; lower numbers take profit sooner.
Minimum Profit Floor %: A hard limit ensuring the target never drops below this percentage, even in extremely low-volatility markets.
📉 Trend & Momentum Filters
Trend Strength Threshold: Defines the minimum "velocity" required to trade. This filters out flat, ranging markets where trends are not established.
Momentum Sensitivity (K/D/Smooth): These variables tune the sensitivity of the entry trigger.
Lower numbers = Faster entries (more trades, potentially more noise).
Higher numbers = Slower, more confirmed entries.
Overbought / Oversold Levels: The specific zones (0-100) where price is considered statistically over-extended, triggering a reversal signal.
🛡️ Risk & DCA Settings
Enable Hard Stop Loss: A traditional safety stop based on a fixed percentage.
Max DCA Orders: The maximum number of times the strategy is allowed to "average down" on a position.
Require Trend for DCA?: If TRUE, the strategy will only add to a losing position if the broader market trend is still valid. If the trend breaks, it stops buying.
DCA Volatility Length/Multiplier: Controls the spacing between buy orders.
High Multiplier = Orders are spread far apart (safer for crashes).
Low Multiplier = Orders are closer together (faster recovery in normal dips).
Risk Scaling: A unique feature that pushes DCA orders further away as your leverage increases, protecting you from adding too much risk too quickly.
Base DCA %: The minimum distance required between orders, regardless of volatility.
⏱️ Timers & Cooldowns
Fast / Slow Cooldown: The minimum time (in seconds) the strategy must wait between realizing a profit and opening a new trade. This prevents "revenge trading" or entering twice on the same candle.
Position Cooldown: A specific timer applied after a large position is closed to let the market settle.
🎯 Daily S/R Targets
Enable Daily S/R: If enabled, the strategy will attempt to "snipe" exits at calculated daily support and resistance pivots.
Proximity Threshold: How close the price must get to a daily level to trigger an early exit.
⚠️ Risk Disclaimer
This script is an automated tool for analysis and execution assistance. It employs averaging techniques (DCA) which involve calculated risk. While the "Kill Switch" and "Risk Scaling" features are designed to mitigate exposure, users should thoroughly backtest and understand the "Multiplier" settings before deploying real capital. Past market structure is not a guarantee of future performance.

The Oracle: Dip & Top Adaptive Sniper [Hakan Yorganci]█ OVERVIEW
The Oracle: Dip & Top Adaptive Sniper is a precision-focused trend trading strategy designed to solve the biggest problem in swing trading: Timing.
Most trend-following strategies chase price ("FOMO"), buying when the asset is already overextended. The Oracle takes a different approach. It adopts a "Sniper" mentality: it identifies a strong macro trend but patiently waits for a Mean Reversion (pullback) to execute an entry at a discounted price.
By combining the structural strength of Moving Averages (SMA 50/200) with the momentum precision of RSI and the volatility filtering of ADX, this script filters out noise and targets high-probability setups.
█ HOW IT WORKS
This strategy operates on a strictly algorithmic protocol known as "The Yorganci Protocol," which involves three distinct phases: Filter, Target, and Execute.
1. The Macro Filter (Trend Identification)
* SMA 200 Rule: By default, the strategy only scans for buy signals when the price is trading above the 200-period Simple Moving Average. This ensures we are always trading in the direction of the long-term bull market.
* Adaptive Switch: A new feature allows users to toggle the Only Buy Above SMA 200? filter OFF. This enables the strategy to hunt for oversold bounces (dead cat bounces) even during bearish or neutral market structures.
2. The Volatility Filter (ADX Integration)
* Sideways Protection: One of the main weaknesses of moving average strategies is "whipsaw" losses during choppy, ranging markets.
* Solution: The Oracle utilizes the ADX (Average Directional Index). It will BLOCK any trade entry if the ADX is below the threshold (Default: 20). This ensures capital is only deployed when a genuine trend is present.
3. The Sniper Entry (Buying the Dip)
* Instead of buying on breakout strength (e.g., RSI > 60), The Oracle waits for the RSI Moving Average to dip into the "Value Zone" (Default: 45) and cross back up. This technique allows for tighter stops and higher Risk/Reward ratios compared to traditional breakout systems.
█ EXIT STRATEGY
The Oracle employs a dynamic dual-exit mechanism to maximize gains and protect capital:
* Take Profit (The Peak): The strategy monitors RSI heat. When the RSI Moving Average breaches the Overbought Threshold (Default: 75), it signals a "Take Profit", securing gains near the local top before a potential reversal.
* Stop Loss (Trend Invalidated): If the market structure fails and the price closes below the 50-period SMA, the position is immediately closed to prevent deep drawdowns.
█ SETTINGS & CONFIGURATION
* Moving Averages: Fully customizable lengths for Support (SMA 50) and Trend (SMA 200).
* Trend Filter: Checkbox to enable/disable the "Bull Market Only" rule.
* RSI Thresholds:
* Sniper Buy Level: Adjustable (Default: 45). Lower values = Deeper dips, fewer trades.
* Peak Sell Level: Adjustable (Default: 75). Higher values = Longer holds, potentially higher profit.
* ADX Filter: Checkbox to enable/disable volatility filtering.
█ BEST PRACTICES
* Timeframe: Designed primarily for 4H (4-Hour) charts for swing trading. It can also be used on 1H for more frequent signals.
* Assets: Highly effective on trending assets such as Bitcoin (BTC), Ethereum (ETH), and high-volume Altcoins.
* Risk Warning: This strategy is designed for "Long Only" spot or leverage trading. Always use proper risk management.
█ CREDITS
* Original Concept: Inspired by the foundational work of Murat Besiroglu (@muratkbesiroglu).
* Algorithm Development & Enhancements: Developed by Hakan Yorganci (@hknyrgnc).
* Modifications include: Integration of ADX filters, Mean Reversion entry logic (RSI Dip), and Dynamic Peak Profit taking.

Mean Reversion — BB + Z-Score + RSI + EMA200 (TP at Opposite Z)This is a systematic mean-reversion framework for index futures and other liquid assets.
This strategy combines Bollinger Bands, Z-Score dislocation, RSI extremes, and a trend-filtering EMA200 to capture short-term mean-reversion inefficiencies in NQ1!. It is designed for high-volatility conditions and uses a precise exit model based on opposite-side Z-Score targets and dynamic mid-band failure detection.
🔍 Entry Logic (Mean Reversion) :
The strategy enters trades only when multiple confluence signals align:
Long Setup
Price at or below the lower Bollinger Band
Z-Score ≤ –Threshold (deep statistical deviation)
RSI ≤ oversold level
Price below the EMA-200 (countertrend mean-reversion only)
Cooldown must be completed
No open position
Short Setup
Price at or above the upper Bollinger Band
Z-Score ≥ Threshold
RSI ≥ overbought level
Price above the EMA-200
Cooldown complete
No open position
This multi-signal gate filters out weak reversions and focuses on mature dislocations.
🎯 Take-Profit Model: Opposite-Side Z-Score Target :
Once in a trade, take-profit is set by solving for the price where the Z-Score reaches the opposite side:
Long TP = Z = +Threshold
Short TP = Z = –Threshold
This creates a symmetric statistical exit based on reverting to equilibrium plus overshoot.
🛡️ Stop-Loss System (Volatility-Aware) :
Stop losses combine:
A fixed base stop (points)
A standard-deviation volatility component
This adapts the SL to regime changes and avoids being shaken out during rare volatility spikes.
⏳ Half-Life Exit :
If a trade has not reverted within a fixed number of bars, it automatically closes.
This prevents “mean-reversion traps” during trending periods.
📉 Advanced Mid-Band Exit Logic (BB Basis Failure) :
This is the unique feature of the system.
After entry:
Wait for price to cross the Bollinger Basis (middle band) in the direction of the mean.
Start a 5-bar delay timer.
After 5 bars, the strategy becomes “armed.”
Once armed:
If price fails back through the mean, exit immediately.
Intrabar exits trigger precisely (with tick-level precision if Bar Magnifier is enabled).
This protects profits and exits trades at the first sign of mean-failure.
⏱️ Cooldown System :
After each closed trade, a cooldown period prevents immediate re-entry.
This avoids clustering and improves statistical independence of trades.
🖥️ What This Strategy Is Best For :
High-volatility intraday NQ conditions
Statistical mean reversion with structured confluence
Traders who want clean, rule-based entries
Avoiding trend-day traps using EMA and half-life logic
📊 Included Visual Elements :
Bollinger Bands (Upper, Basis, Lower)
BUY/SELL markers at signal generation
Optional alerts for automated monitoring
🚀 Summary :
This is a precision mean-reversion system built around volatility bands, statistical dislocation, and price-behavior confirmation. By combining Z-Score, RSI, EMA200 filtering, and a sophisticated mid-band failure exit, this model captures high-probability reversions while avoiding the common pitfalls of naive band-touch systems.

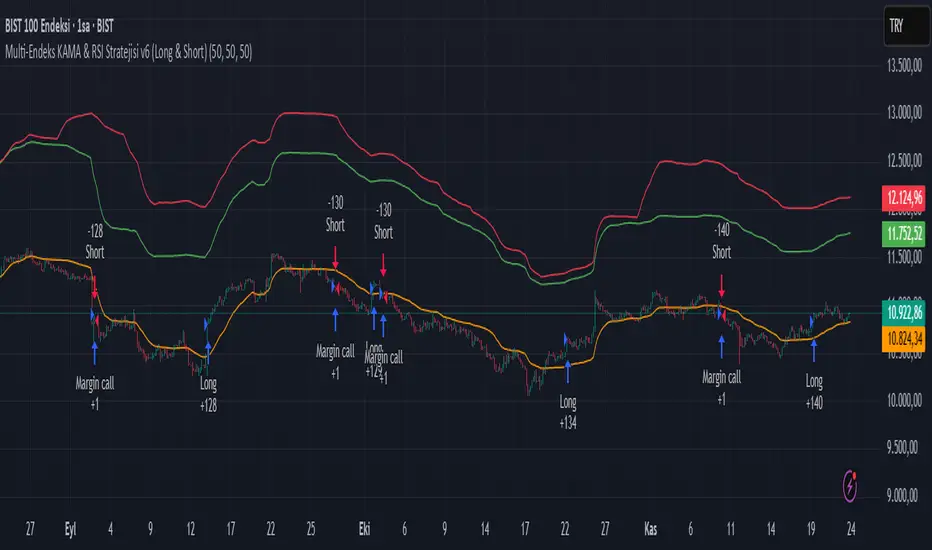
Multi-Endeks KAMA & RSI Stratejisi v6 (Long & Short)Multi-Index KAMA & RSI Strategy v6 (Long & Short)
This is a hybrid trading strategy that combines two powerful technical analysis tools—the Kaufman's Adaptive Moving Average (KAMA) for trend following and the Relative Strength Index (RSI) for measuring momentum and identifying overbought/oversold conditions.
The term "Multi-Index" suggests that the decision-making process might incorporate data or conditions from several different market indices or timeframes, rather than just the single asset being traded.
🧭 Core Components
1. KAMA (Kaufman's Adaptive Moving Average)
KAMA is an adaptive moving average developed by quantitative financial theorist Perry J. Kaufman.
Adaptivity: Unlike standard moving averages, KAMA automatically adjusts its smoothing factor (speed) based on market volatility.
Mechanism:
Trending Markets (Low Noise): When prices move clearly in one direction (low volatility), KAMA speeds up, hugging the price closely and providing fast signals.
Sideways Markets (High Noise): When prices are choppy (high volatility/noise), KAMA slows down, smoothing out price fluctuations to reduce the risk of whipsaws (false signals).
Role in Strategy: To define the main trend direction. The position of the price relative to the KAMA line determines the base directional bias (Long or Short).
2. RSI (Relative Strength Index)
RSI is a momentum oscillator developed by J. Welles Wilder Jr. that measures the speed and change of price movements.
Overbought/Oversold: It oscillates between 0 and 100. Conventionally, a reading above 70 suggests overbought conditions (potential sell signal), and a reading below 30 suggests oversold conditions (potential buy signal).
Role in Strategy: Timing and Confirmation. Once the trend is confirmed by KAMA, the RSI acts as a timing filter, often confirming an entry as it moves away from extreme overbought (for Short) or oversold (for Long) levels.
📉 Potential Trading Logic (V6)
This "v6" strategy likely aims to capture more reliable entries by requiring both trend (KAMA) and momentum (RSI) alignment:
1. LONG (Buy) Entry Conditions
Trend Confirmation (KAMA): The asset's price (Closing Price) must be above the KAMA line (confirming an uptrend).
Momentum Confirmation (RSI):
Option A (Reversal): The RSI must cross above the 30 level (exiting oversold) or decisively move above the 50 level.
Option B (Trend-Continuation): In a strong uptrend, the RSI might bounce off the 40-50 zone and turn upwards, confirming trend continuation.
2. SHORT (Sell) Entry Conditions
Trend Confirmation (KAMA): The asset's price (Closing Price) must be below the KAMA line (confirming a downtrend).
Momentum Confirmation (RSI):
Option A (Reversal): The RSI must cross below the 70 level (exiting overbought) or decisively move below the 50 level.
Option B (Trend-Continuation): In a strong downtrend, the RSI might be rejected from the 50-60 zone and turn downwards, confirming continuation.
3. Exit Management
The strategy likely utilizes dynamic risk controls:
Stop-Loss: A dynamic stop placed on the opposite side of the KAMA, or an ATR-based distance to adjust to volatility.
Take-Profit: Conditions such as the RSI reaching extreme levels or the KAMA line being crossed in the reverse direction.
🌟 Implication of the "V6" Version
The "v6" designation implies that the strategy has been refined and iterated upon over time to address weaknesses in prior versions (v1, v2, etc.). These improvements might include:
Filters: Adding stricter RSI or KAMA cross filters to reduce false signals.
Multi-Index Logic: Using the RSI or KAMA of a secondary instrument (e.g., a major index or volatility measure) as a macro filter for the main trade execution.
Optimization: Optimizing the default lookback periods for KAMA and RSI for different asset classes.
ATH대비 지정하락률에 도착 시 매수 - 장기홀딩 선물 전략(ATH Drawdown Re-Buy Long Only)본 스크립트는 과거 하락 데이터를 이용하여, 정해진 하락 %가 발생하는 경우 자기 자본의 정해진 %만큼을 진입하게 설계되어진 스트레티지입니다.
레버리지를 사용할 수 있으며 기본적으로 셋팅해둔 값이 내장되어있습니다.(자유롭게 바꿔서 쓰시면 됩니다.) 추가적으로 2번의 진입 외에도 다른 진입 기준, 진입 %를 설정하실 수 있으며 - ChatGPT에게 요청하면 수정해줄 것입니다.
실제 사용용도로는 KillSwitch 기능을 꺼주세요. 바 돋보기 기능을 켜주세요.
ATH Drawdown Re-Buy Long Only 전략 설명
1. 전략 개요
ATH Drawdown Re-Buy Long Only 전략은 자산의 역대 최고가(ATH, All-Time High)를 기준으로 한 하락폭(드로우다운)을 활용하여,
특정 구간마다 단계적으로 롱 포지션을 구축하는 자동 재매수(Long Only) 전략입니다.
본 전략은 다음과 같은 목적을 가지고 설계되었습니다.
급격한 조정 구간에서 체계적인 분할 매수 및 레버리지 활용
ATH를 기준으로 한 명확한 진입 규칙 제공
실시간으로
평단가
레버리지
청산가 추정
계좌 MDD
수익률
등을 시각적으로 제공하여 리스크와 포지션 상태를 직관적으로 확인할 수 있도록 지원
※ 본 전략은 교육·연구·백테스트 용도로 제공되며,
어떠한 형태의 투자 권유 또는 수익을 보장하지 않습니다.
2. 전략의 핵심 개념
2-1. ATH(역대 최고가) 기준 드로우다운
전략은 차트 상에서 항상 가장 높은 고가(High)를 ATH로 기록합니다.
새로운 고점이 형성될 때마다 ATH를 갱신하고, 해당 ATH를 기준으로 다음을 계산합니다.
현재 바의 저가(Low)가 ATH에서 몇 % 하락했는지
현재 바의 종가(Close)가 ATH에서 몇 % 하락했는지
그리고 사전에 설정한 두 개의 드로우다운 구간에서 매수를 수행합니다.
1차 진입 구간: ATH 대비 X% 하락 시
2차 진입 구간: ATH 대비 Y% 하락 시
각 구간은 ATH가 새로 갱신될 때마다 한 번씩만 작동하며,
새로운 ATH가 생성되면 다시 “1차 / 2차 진입 가능 상태”로 초기화됩니다.
2-2. 첫 포지션 100% / 300% 특수 규칙
이 전략의 중요한 특징은 **“첫 포지션 진입 시의 예외 규칙”**입니다.
전략이 현재 어떠한 포지션도 들고 있지 않은 상태에서
최초로 롱 포지션을 진입하는 시점(첫 포지션)에 대해:
기본적으로는 **자산의 100%**를 기준으로 포지션을 구축하지만,
만약 그 순간의 가격이 ATH 대비 설정값 이상(예: 약 –72.5% 이상 하락한 상황) 이라면
→ 자산의 300% 규모로 첫 포지션을 진입하도록 설계되어 있습니다.
이 규칙은 다음과 같이 동작합니다.
첫 진입이 1차 드로우다운 구간에서 발생하든,
첫 진입이 2차 드로우다운 구간에서 발생하든,
현재 하락폭이 설정된 기준 이상(예: –72.5% 이상) 이라면
→ “이 정도 하락이면 첫 진입부터 더 공격적으로 들어간다”는 의미로 300% 규모로 진입
그 이하의 하락폭이라면
→ 첫 진입은 100% 규모로 제한
즉, 전략은 다음 두 가지 모드로 동작합니다.
일반적인 상황의 첫 진입: 자산의 100%
심각한 드로우다운 구간에서의 첫 진입: 자산의 300%
이 특수 규칙은 깊은 하락에서는 공격적으로, 평소에는 상대적으로 보수적으로 진입하도록 설계된 것입니다.
3. 전략 동작 구조
3-1. 매수 조건
차트 상 High 기준으로 ATH를 추적합니다.
각 바마다 해당 ATH에서의 하락률을 계산합니다.
사용자가 설정한 두 개의 드로우다운 구간(예시):
1차 구간: 예를 들어 ATH – 50%
2차 구간: 예를 들어 ATH – 72.5%
각 구간에 대해 다음과 같은 조건을 확인합니다.
“이번 ATH 구간에서 아직 해당 구간 매수를 한 적이 없는 상태”이고,
현재 바의 저가(Low)가 해당 구간 가격 이하를 찍는 순간
→ 해당 바에서 매수 조건 충족으로 간주
실제 주문은:
해당 구간 가격에 맞춰 롱 포지션 진입(리밋/시장가 기반 시뮬레이션) 으로 처리됩니다.
3-2. ATH 갱신과 진입 기회 리셋
차트 상에서 새로운 고점(High)이 기존 ATH를 넘어서는 순간,
ATH가 갱신되고,
1차 / 2차 진입 여부를 나타내는 내부 플래그가 초기화됩니다.
이를 통해, 시장이 새로운 고점을 돌파해 나갈 때마다,
해당 구간에서 다시 한 번씩 1차·2차 드로우다운 진입 기회를 갖게 됩니다.
4. 포지션 사이징 및 레버리지
4-1. 계좌 자산(Equity) 기준 포지션 크기 결정
전략은 현재 계좌 자산을 다음과 같이 정의하여 사용합니다.
현재 자산 = 초기 자본 + 실현 손익 + 미실현 손익
각 진입 구간에서의 포지션 가치는 다음과 같이 결정됩니다.
1차 진입 구간:
“자산의 몇 %를 사용할지”를 설정값으로 입력
설정된 퍼센트를 계좌 자산에 곱한 뒤,
다시 전략 내 레버리지 배수(Leverage) 를 곱하여 실제 포지션 가치를 계산
2차 진입 구간:
동일한 방식으로, 독립된 퍼센트 설정값을 사용
즉, 포지션 가치는 다음과 같이 계산됩니다.
포지션 가치 = 현재 자산 × (해당 구간 설정 % / 100) × 레버리지 배수
그리고 이를 해당 구간의 진입 가격으로 나누어 실제 수량(토큰 단위) 를 산출합니다.
4-2. 첫 포지션의 예외 처리 (100% / 300%)
첫 포지션에 대해서는 위의 일반적인 퍼센트 설정 대신,
다음과 같은 고정 비율이 사용됩니다.
기본: 자산의 100% 규모로 첫 포지션 진입
단, 진입 시점의 ATH 대비 하락률이 설정값 이상(예: –72.5% 이상) 일 경우
→ 자산의 300% 규모로 첫 포지션 진입
이때 역시 다음 공식을 사용합니다.
포지션 가치 = 현재 자산 × (100% 또는 300%) × 레버리지
그리고 이를 가격으로 나누어 실제 진입 수량을 계산합니다.
이 규칙은:
첫 진입이 1차 구간이든 2차 구간이든 동일하게 적용되며,
“충분히 깊은 하락 구간에서는 첫 진입부터 더 크게,
평소에는 비교적 보수적으로” 라는 운용 철학을 반영합니다.
4-3. 실레버리지(Real Leverage)의 추적
전략은 각 바 단위로 다음을 추적합니다.
바가 시작할 때의 기존 포지션 크기
해당 바에서 새로 진입한 수량
이를 바탕으로, 진입이 발생한 시점에 다음을 계산합니다.
실제 레버리지 = (포지션 가치 / 현재 자산)
그리고 차트 상에 예를 들어:
Lev 2.53x 와 같은 형식의 레이블로 표시합니다.
이를 통해, 매수 시점마다 실제 계좌 레버리지가 어느 정도였는지를 직관적으로 확인할 수 있습니다.
5. 시각화 및 모니터링 요소
5-1. 차트 상 시각 요소
전략은 차트 위에 다음과 같은 정보를 직접 표시합니다.
ATH 라인
High 기준으로 계산된 역대 최고가를 주황색 선으로 표시
평단가(평균 진입가) 라인
현재 보유 포지션이 있을 때,
해당 포지션의 평균 진입가를 노란색 선으로 표시
추정 청산가(고정형 청산가) 라인
포지션 수량이 변화하는 시점을 감지하여,
당시의 평단가와 실제 레버리지를 이용해 근사적인 청산가를 계산
이를 빨간색 선으로 차트에 고정 표시
포지션이 없거나 레버리지가 1배 이하인 경우에는 청산가 라인을 제거
매수 마커 및 레이블
1차/2차 매수 조건이 충족될 때마다 해당 지점에 매수 마커를 표시
"Buy XX% @ 가격", "Lev XXx" 형태의 라벨로
진입 비율과 당시 레버리지를 함께 시각화
레이블의 위치는 설정에서 선택 가능:
바 아래 (Below Bar)
바 위 (Above Bar)
실제 가격 위치 (At Price)
5-2. 우측 상단 정보 테이블
차트 우측 상단에는 현재 계좌·포지션 상태를 요약한 정보 테이블이 표시됩니다.
대표적으로 다음 항목들이 포함됩니다.
Pos Qty (Token)
현재 보유 중인 포지션 수량(토큰 기준, 절대값 기준)
Pos Value (USDT)
현재 포지션의 시장 가치 (수량 × 현재 가격)
Leverage (Now)
현재 실레버리지 (포지션 가치 / 현재 자산)
DD from ATH (%)
현재 가격 기준, 최근 ATH에서의 하락률(%)
Avg Entry
현재 포지션의 평균 진입 가격
PnL (%)
현재 포지션 기준 미실현 손익률(%)
Max DD (Equity %)
전략 전체 기간 동안 기록된 계좌 기준 최대 손실(MDD, Max Drawdown)
Last Entry Price
가장 최근에 포지션을 추가로 진입한 직후의 평균 진입 가격
Last Entry Lev
위 “Last Entry Price” 시점에서의 실레버리지
Liq Price (Fixed)
위에서 설명한 고정형 추정 청산가
Return from Start (%)
전략 시작 시점(초기 자본) 대비 현재 계좌 자산의 총 수익률(%)
이 테이블을 통해 사용자는:
현재 계좌와 포지션의 상태
리스크 수준
누적 성과
를 직관적으로 파악할 수 있습니다.
6. 시간 필터 및 라벨 옵션
6-1. 전략 동작 기간 설정
전략은 옵션으로 특정 기간에만 전략을 동작시키는 시간 필터를 제공합니다.
“Use Date Range” 옵션을 활성화하면:
시작 시각과 종료 시각을 지정하여
해당 구간에 한해서만 매매가 발생하도록 제한
옵션을 비활성화하면:
전략은 전체 차트 구간에서 자유롭게 동작
6-2. 진입 라벨 위치 설정
사용자는 매수/레버리지 라벨의 위치를 선택할 수 있습니다.
바 아래 (Below Bar)
바 위 (Above Bar)
실제 가격 위치 (At Price)
이를 통해 개인 취향 및 차트 가독성에 맞추어
시각화 방식을 유연하게 조정할 수 있습니다.
7. 활용 대상 및 사용 예시
본 전략은 다음과 같은 목적에 적합합니다.
현물 또는 선물 롱 포지션 기준 장기·스윙 관점 추매 전략 백테스트
“고점 대비 하락률”을 기준으로 한 규칙 기반 운용 아이디어 검증
레버리지 사용 시
계좌 레버리지·청산가·MDD를 동시에 모니터링하고자 하는 경우
특정 자산에 대해
“새로운 고점이 형성될 때마다
일정한 규칙으로 깊은 조정 구간에서만 분할 진입하고자 할 때”
실거래에 그대로 적용하기보다는,
전략 아이디어 검증 및 리스크 프로파일 분석,
자신의 성향에 맞는 파라미터 탐색 용도로 사용하는 것을 권장합니다.
8. 한계 및 유의사항
백테스트 결과는 미래 성과를 보장하지 않습니다.
과거 데이터에 기반한 시뮬레이션일 뿐이며,
실제 시장에서는
유동성
슬리피지
수수료 체계
강제청산 규칙
등 다양한 변수가 존재합니다.
청산가는 단순화된 공식에 따른 추정치입니다.
거래소별 실제 청산 규칙, 유지 증거금, 수수료, 펀딩비 등은
본 전략의 계산과 다를 수 있으며,
청산가 추정 라인은 참고용 지표일 뿐입니다.
레버리지 및 진입 비율 설정에 따라 손실 폭이 매우 커질 수 있습니다.
특히 **“첫 포지션 300% 진입”**과 같이 매우 공격적인 설정은
시장 급락 시 계좌 손실과 청산 리스크를 크게 증가시킬 수 있으므로
신중한 검토가 필요합니다.
실거래 연동 시에는 별도의 리스크 관리가 필수입니다.
개별 손절 기준
포지션 상한선
전체 포트폴리오 내 비중 관리 등
본 전략 외부에서 추가적인 안전장치가 필요합니다.
9. 결론
ATH Drawdown Re-Buy Long Only 전략은 단순한 “저가 매수”를 넘어서,
ATH 기준으로 드로우다운을 구조적으로 활용하고,
첫 포지션에 대한 **특수 규칙(100% / 300%)**을 적용하며,
레버리지·청산가·MDD·수익률을 통합적으로 시각화함으로써,
하락 구간에서의 규칙 기반 롱 포지션 구축과
리스크 모니터링을 동시에 지원하는 전략입니다.
사용자는 본 전략을 통해:
자신의 시장 관점과 리스크 허용 범위에 맞는
드로우다운 구간
진입 비율
레버리지 설정
다양한 시나리오에 대한 백테스트와 분석
을 수행할 수 있습니다.
다시 한 번 강조하지만,
본 전략은 연구·학습·백테스트를 위한 도구이며,
실제 투자 판단과 책임은 전적으로 사용자 본인에게 있습니다.
/ENG Version.
This script is designed to use historical drawdown data and automatically enter positions when a predefined percentage drop from the all-time high occurs, using a predefined percentage of your account equity.
You can use leverage, and default parameter values are provided out of the box (you can freely change them to suit your style).
In addition to the two main entry levels, you can add more entry conditions and custom entry percentages – just ask ChatGPT to modify the script.
For actual/live usage, please turn OFF the KillSwitch function and turn ON the Bar Magnifier feature.
ATH Drawdown Re-Buy Long Only Strategy
1. Strategy Overview
The ATH Drawdown Re-Buy Long Only strategy is an automatic re-buy (Long Only) system that builds long positions step-by-step at specific drawdown levels, based on the asset’s all-time high (ATH) and its subsequent drawdown.
This strategy is designed with the following goals:
Systematic scaled buying and leverage usage during sharp correction periods
Clear, rule-based entry logic using drawdowns from ATH
Real-time visualization of:
Average entry price
Leverage
Estimated liquidation price
Account MDD (Max Drawdown)
Return / performance
This allows traders to intuitively monitor both risk and position status.
※ This strategy is provided for educational, research, and backtesting purposes only.
It does not constitute investment advice and does not guarantee any profits.
2. Core Concepts
2-1. Drawdown from ATH (All-Time High)
On the chart, the strategy always tracks the highest high as the ATH.
Whenever a new high is made, ATH is updated, and based on that ATH the following are calculated:
How many percent the current bar’s Low is below the ATH
How many percent the current bar’s Close is below the ATH
Using these, the strategy executes buys at two predefined drawdown zones:
1st entry zone: When price drops X% from ATH
2nd entry zone: When price drops Y% from ATH
Each zone is allowed to trigger only once per ATH cycle.
When a new ATH is created, the “1st / 2nd entry possible” flags are reset, and new opportunities open up for that ATH leg.
2-2. Special Rule for the First Position (100% / 300%)
A key feature of this strategy is the special rule for the very first position.
When the strategy currently holds no position and is about to open the first long position:
Under normal conditions, it builds the position using 100% of account equity.
However, if at that moment the price has dropped by at least a predefined threshold from ATH (e.g. around –72.5% or more),
→ the strategy will open the first position using 300% of account equity.
This rule works as follows:
Whether the first entry happens at the 1st drawdown zone or at the 2nd drawdown zone,
If the current drawdown from ATH is at or below the threshold (e.g. –72.5% or worse),
→ the strategy interprets this as “a sufficiently deep crash” and opens the initial position with 300% of equity.
If the drawdown is less severe than the threshold,
→ the first entry is capped at 100% of equity.
So the strategy has two modes for the first entry:
Normal market conditions: 100% of equity
Deep drawdown conditions: 300% of equity
This special rule is intended to be aggressive in extremely deep crashes while staying more conservative in normal corrections.
3. Strategy Logic & Execution
3-1. Entry Conditions
The strategy tracks the ATH using the High price.
For each bar, it calculates the drawdown from ATH.
The user defines two drawdown zones, for example:
1st zone: ATH – 50%
2nd zone: ATH – 72.5%
For each zone, the strategy checks:
If no buy has been executed yet for that zone in the current ATH leg, and
If the current bar’s Low touches or falls below that zone’s price level,
→ That bar is considered to have triggered a buy condition.
Order simulation:
The strategy simulates entering a long position at that zone’s price level
(using a limit/market-like approximation for backtesting).
3-2. ATH Reset & Entry Opportunity Reset
When a new High goes above the previous ATH:
The ATH is updated to this new high.
Internal flags that track whether the 1st and 2nd entries have been used are reset.
This means:
Each time the market makes a new ATH,
The strategy once again has a fresh opportunity to execute 1st and 2nd drawdown entries for that new ATH leg.
4. Position Sizing & Leverage
4-1. Position Size Based on Account Equity
The strategy defines current equity as:
Current Equity = Initial Capital + Realized PnL + Unrealized PnL
For each entry zone, the position value is calculated as follows:
The user inputs:
“What % of equity to use at this zone”
The strategy:
Multiplies current equity by that percentage
Then multiplies by the strategy’s leverage factor
Thus:
Position Value = Current Equity × (Zone % / 100) × Leverage
Finally, this position value is divided by the entry price to determine the actual position size in tokens.
4-2. Exception for the First Position (100% / 300%)
For the very first position (when there is no open position),
the strategy does not use the zone % parameters. Instead, it uses fixed ratios:
Default: Enter the first position with 100% of equity.
If the drawdown from ATH at that moment is greater than or equal to a predefined threshold (e.g. –72.5% or more)
→ Enter the first position with 300% of equity.
The position value is computed as:
Position Value = Current Equity × (100% or 300%) × Leverage
Then it is divided by the entry price to obtain the token quantity.
This rule:
Applies regardless of whether the first entry occurs at the 1st zone or 2nd zone.
Embeds the philosophy:
“In very deep crashes, go much larger on the first entry; otherwise, stay more conservative.”
4-3. Tracking Real Leverage
On each bar, the strategy tracks:
The existing position size at the start of the bar
The newly added size (if any) on that bar
When a new entry occurs, it calculates the real leverage at that moment:
Real Leverage = (Position Value / Current Equity)
This is then displayed on the chart as a label, for example:
Lev 2.53x
This makes it easy to see the actual leverage level at each entry point.
5. Visualization & Monitoring
5-1. On-Chart Visual Elements
The strategy plots the following directly on the chart:
ATH Line
The all-time high (based on High) is plotted as an orange line.
Average Entry Price Line
When a position is open, the average entry price of that position is plotted as a yellow line.
Estimated Liquidation Price (Fixed) Line
The strategy detects when the position size changes.
At each size change, it uses the current average entry price and real leverage to compute an approximate liquidation price.
This “fixed liquidation price” is then plotted as a red line on the chart.
If there is no position, or if leverage is 1x or lower, the liquidation line is removed.
Entry Markers & Labels
When 1st/2nd entry conditions are met, the strategy:
Marks the entry point on the chart.
Displays labels such as "Buy XX% @ Price" and "Lev XXx",
showing both entry percentage and real leverage at that time.
The label placement is configurable:
Below Bar
Above Bar
At Price
5-2. Information Table (Top-Right Panel)
In the top-right corner of the chart, the strategy displays a summary table of the current account and position status. It typically includes:
Pos Qty (Token)
Absolute size of the current position (in tokens)
Pos Value (USDT)
Market value of the current position (qty × current price)
Leverage (Now)
Current real leverage (position value / current equity)
DD from ATH (%)
Current drawdown (%) from the latest ATH, based on current price
Avg Entry
Average entry price of the current position
PnL (%)
Unrealized profit/loss (%) of the current position
Max DD (Equity %)
The maximum equity drawdown (MDD) recorded over the entire backtest period
Last Entry Price
Average entry price immediately after the most recent add-on entry
Last Entry Lev
Real leverage at the time of the most recent entry
Liq Price (Fixed)
The fixed estimated liquidation price described above
Return from Start (%)
Total return (%) of equity compared to the initial capital
Through this table, users can quickly grasp:
Current account and position status
Current risk level
Cumulative performance
6. Time Filters & Label Options
6-1. Strategy Date Range Filter
The strategy provides an option to restrict trading to a specific time range.
When “Use Date Range” is enabled:
You can specify start and end timestamps.
The strategy will only execute trades within that range.
When this option is disabled:
The strategy operates over the entire chart history.
6-2. Entry Label Placement
Users can customize where entry/leverage labels are drawn:
Below Bar (Below Bar)
Above Bar (Above Bar)
At the actual price level (At Price)
This allows you to adjust visualization according to personal preference and chart readability.
7. Use Cases & Applications
This strategy is suitable for the following purposes:
Long-term / swing-style re-buy strategies for spot or futures long positions
Testing rule-based strategies that rely on “drawdown from ATH” as a main signal
Monitoring account leverage, liquidation price, and MDD when using leverage
Handling situations where, for a given asset:
“Every time a new ATH is formed,
you want to wait for deep corrections and enter only at specific drawdown zones”
It is generally recommended to use this strategy not as a direct plug-and-play live system, but as a tool for:
Strategy idea validation
Risk profile analysis
Parameter exploration to match your personal risk tolerance and style
8. Limitations & Warnings
Backtest results do not guarantee future performance.
They are based on historical data only.
In live markets, additional factors exist:
Liquidity
Slippage
Fee structures
Exchange-specific liquidation rules
Funding fees, etc.
The liquidation price is only an approximate estimate, derived from a simplified formula.
Actual liquidation rules, maintenance margin requirements, fees, and other details differ by exchange.
The liquidation line should be treated as a reference indicator, not an exact guarantee.
Depending on the configured leverage and entry percentages, losses can be very large.
In particular, extremely aggressive settings such as “first position 300% of equity” can greatly increase the risk of large account drawdowns and liquidation during sharp market crashes.
Use such settings with extreme caution.
For live trading, additional risk management is essential:
Your own stop-loss rules
Maximum position size limits
Portfolio-level exposure controls
And other external safety mechanisms beyond this strategy
9. Conclusion
The ATH Drawdown Re-Buy Long Only strategy goes beyond simple “buy the dip” logic. It:
Systematically utilizes drawdowns from ATH as a structural signal
Applies a special first-position rule (100% / 300%)
Integrates visualization of leverage, liquidation price, MDD, and returns
All of this supports rule-based long position building in drawdown phases and comprehensive risk monitoring.
With this strategy, users can:
Explore different:
Drawdown zones
Entry percentages
Leverage levels
Run various backtests and scenario analyses
Better understand the risk/return profile that fits their own market view and risk tolerance
Once again, this strategy is intended for research, learning, and backtesting only.
All real trading decisions and their consequences are solely the responsibility of the user.

Adaptive Cortex Strategy (ACS)Strategy Title: Adaptive Cortex Strategy (ACS)
This script is invite-only.
Part 1: Philosophy and the Fundamental Problem It Solves
Adaptive Cortex Strategy (ACS) is an advanced decision support system designed to dynamically adapt to the ever-changing characteristics of the market. A major weakness of traditional approaches is that while successful in a specific market condition (e.g., a strong trend), they become ineffective when the market changes course (e.g., enters a sideways range). ACS solves this problem by continuously analyzing the market's current "regime" and instantly adapting its decision-making logic accordingly.
Its primary goal is to enable the strategy itself to "think" and evolve with the market, without requiring the trader to change their strategy.
Part 2: Original Methodology and Proprietary Logic
A Note on the Original Methodology and Intellectual Property
This algorithm is not based on or copied from any open-source strategy code. The system utilizes the mathematical principles of widely accepted indicators such as ADX, RSI, and Ichimoku as data sources for its analyses.
However, the intellectual property and unique value of the algorithm lies in its unique and closed-source architecture that processes, prioritizes, and synthesizes data from these standard tools. The methods used in core components, particularly the adaptive 'Cortex' memory system and statistical 'Forecast' engine, represent a unique set of logic developed from scratch for this script. The parameters, order of operations, and conditional logic are entirely custom-designed. Therefore, the system's performance is a result of its unique design, not a repetition of publicly available code.
ACS's power lies not in the individual indicators it uses, but in the unique and proprietary logic layers that process the information from these indicators.
1. Multi-Factor Scoring and Adaptive Weighting:
The heart of the methodology is a scoring system that analyzes the market in four main categories: Trend, Support/Resistance, Momentum, and Volume. However, what makes ACS unique is that it dynamically changes the importance it assigns to these categories based on the market regime.
Unique Application: Using ADX, DMI, and ATR indicators, the system detects whether the market is in different regimes, such as "Strong Trend" or "High Volatility Squeeze." When it detects a strong trend, it automatically increases the weight of the Trend scores from the Ichimoku and proprietary AMF Trend Engine. When it detects sideways or tightness, it shifts its focus to Support/Resistance zones determined by Dynamic Channels and the author's "Cortex" Memory System. A different approach was added here, inspired by the classic Fibonacci estimation. This "adaptive weighting" ensures that the strategy always focuses its attention on the most appropriate area.
2. Statistical Forecast Engine:
ACS goes beyond standard indicators and includes a proprietary forecasting algorithm that measures the probability of a potential price movement's success.
Unique Implementation: The system stores the results of past tests (successful bounces/breakouts) at key price levels in a "brain" (memory). At the time of a new test, it compares the current RSI momentum, volume anomalies, and market regime with similar past situations. Based on this comparison, it calculates the probability of the current test being successful as a statistical percentage and adds this percentage to the final score as a "bonus" or "penalty."
3. Walk-Forward Architecture:
Markets constantly evolve. ACS continues to learn from the latest market dynamics by resetting its memory at regular intervals (e.g., monthly) through its "Re-Learn Mode," rather than being trapped by old data. This is an advanced approach aimed at ensuring the strategy remains current and effective over the long term.
Part 3: Practical Features and User Benefits
HOW DOES IT HELP INVESTORS?
Customizable Trading Profiles: ACS does not come with a single set of settings. Users can instantly adapt all the algorithm's key periods and decision thresholds to their trading style by selecting one of the pre-configured trading profiles, such as "SCALPING," "INTRADAY TREND," or "SWING TRADE." Additionally, they can further fine-tune the selected profile with "Speed Adjustment."
Full Automation Compatibility (JSON): The strategy is equipped with fully configurable JSON-formatted alert messages for buy, sell, and position closing transactions. This makes it possible to establish a fully automated trading system by connecting ACS signals to automation platforms such as 3Commas and PineConnector. Dynamic values such as position size ({{strategy.order.contracts}}) are automatically added to alerts.
Advanced and Adaptive Risk Management: Protecting capital is as important as making a profit. ACS offers a multi-layered risk management framework for this purpose:
Flexible Position Size: Allows you to set the risk for each trade as a percentage of capital or a fixed dollar amount.
Adaptive ATR Stop: The stop-loss level is dynamically expanded or contracted based on current market volatility (the ratio of short-term ATR to long-term ATR).
Contingency Mechanisms: Includes safety nets such as "Maximum Drawdown Protection" and the "Praetorian Guard" engine, which detects sudden market shocks.
Clear and Comprehensible Dashboard: Transforms dozens of complex data points into an intuitive dashboard that provides critical information such as market trends, major trends, support/resistance zones, and final signals at a glance.
Section 4: Disclaimers and Rules
Transparency Note: This algorithm uses the mathematical foundations of publicly available indicators such as ADX, ATR, RSI, and Ichimoku. However, ACS's intellectual property and unique value lies in its unique architecture, which combines data from these standard tools, prioritizes it by market trend, and synthesizes it with its proprietary "Cortex" and "Statistical Forecast" engines.
Educational Use:
IMPORTANT WARNING: The Adaptive Cortex Strategy is a professional decision support and analysis tool. It is NOT a system that promises "guaranteed profits." All trading activities involve the risk of capital loss. Past performance is no guarantee of future results. All signals and analysis generated by this script are for educational purposes only and should not be construed as investment advice. Users are solely responsible for applying their own risk management rules and making their final trading decisions.
Strategy Backtest Information
Please remember that past performance is not indicative of future results. The published chart and performance report were generated on the 4-hour timeframe of the BTC/USD pair with the following settings:
Test Period: January 1, 2016 - November 2, 2025
Default Position Size: 15% of Capital
Pyramiding: Closed
Commission: 0.0008
Slippage: 2 ticks (Please enter the slippage you used in your own tests)
Testing Approach: The published test includes 123 trades and is statistically significant. It is strongly recommended that you test on different assets and timeframes for your own analysis. The default settings are a template and should be adjusted by the user for their own analysis.

Larry Williams Bonus Track PatternThis strategy trades the day immediately following an Inside Day, under specific directional and timing conditions. It is designed for daily-based setups but executed on intraday charts to ensure orders are placed exactly at the open of the following day, rather than at the daily bar close.
Entry Conditions
Only trades on Monday, Thursday, or Friday.
The previous day must be an Inside Day (its high is lower than the prior high and its low is higher than the prior low).
The bar before the Inside Day must be bullish (close > open).
On the following day (t):
The daily open must be below both the Inside Day’s high and the highest high of the two days before that.
A buy stop is placed at the highest high of the three previous days (Inside Day and the two days before it).
If the new day’s open is already above that level (gap up), the strategy enters long immediately at the open.
Exit Rules
Stop Loss: Fixed, defined in points or percentage (user input).
FPO (First Profitable Open): the position is closed at the first daily open after the entry day where the open price is above the average entry price (the first profitable open).
Notes
The script must be applied on an intraday timeframe (e.g., 15-minute or 1-hour) so that the strategy can:
Detect the Inside Day pattern using daily data (request.security).
Execute orders in real time at the next day’s open.
Running it directly on the daily timeframe will delay executions by one bar due to Pine Script’s evaluation model.

KD The ScalperWe have to take the trade when all three EMAs are pointing in the same direction (no criss-cross, no up/down, sideways). All 3 EMAs should be cleanly separated from each other with strong spacing between them; they are not tangled, sideways, or messy. This is our first filter before entering the trade. Are the EMAs stacked neatly, and is the price outside of the 25 EMA? If price pulls back and closes near or below the 25 or 50 EMA and breaks the 100 EMA, we don't trade. Use the 100 EMA as a safety net and refrain from trading if the price touches or falls below the 100 EMA.
1. Confirm the trend- All 3 EMAs must align, and they must spread
2. Watch price pull back to the 25th or the 50 EMA
3. Wait for the price to bounce - And re-approach the 25 EMA
Why is this powerful?
Removes 80% of the low-probability Trades
It keeps you out of choppy markets
Avoids Reversal Traps
Anchors us to momentum
We take the entry when the price moves up again and touches the 25 EMA from below, and then when it breaks above the 25 EMA, or even better, when a lovely green bullish candle forms. A bullish candle indicates good momentum. When a bullish candle closes in green, it means the momentum has increased significantly. This is when we enter a long trade, with the stop-loss just below the 50 EMA and the profit target being 1.5 times the stop-loss.
The same rule applies to the bearish trade.

Elite Momentum Scalper🎯 Perfect For
Scalpers Who Want:
Quick In-and-Out Trades: Designed for 1-15 minute timeframes but works very well on the higer timeframes. Especiall Designed for : Indices ie NAS100 SPX in the New York Session but does work in London session also.
High Win Rate: Multiple confirmations reduce false signals
Consistent Risk: Same risk per trade, every trade
Clean Charts: No indicator spaghetti, just clear signals
Best Markets: Indices ie NAS100 SPX New York Session
Forex Majors: EUR/USD, GBP/USD, USD/JPY
Precious Metals: XAU/USD (Gold), XAG/USD (Silver)
Crypto: BTC/USD, ETH/USD (works 24/7)
Indices: SPX, NAS, DAX during active sessions
Optimal Timeframes:
Primary: 5-minute, 15-minute charts
Works On: Any timeframe (auto-adjusts)
Session-Aware: Best during London/NY overlap
🚨 Built-in Alerts
Never miss a trade:
Entry Alerts: "LONG ENTRY at 1.2345 SL: 1.2300 TP: 1.2400"
Exact Levels: Includes entry, stop, and target prices
Mobile Friendly: Works with TradingView mobile alerts
💡 Pro Tips for Best Results
Setup Recommendations:
Start Conservative: Begin with 1% risk per trade
Respect Sessions: Best results during London/NY hours
Don't Override: Let the cooldown system work
Monitor Dashboard: Keep an eye on daily trade count
Backtest First: Test on historical data before live trading
Risk Management:
Never risk more than you can afford to lose
Use proper position sizing (built-in calculator)
Respect the stop losses (they're there for a reason)
Monitor during high-impact news events
🏆 Why The Elite One?
Based on Fabio Valentini's proven #1 scalper methodology, this isn't just another indicator—it's a complete trading system that:
✅ Eliminates Guesswork: Exact entry, stop, and target levels
✅ Manages Risk: Built-in position sizing and risk management
✅ Prevents Overtrading: Smart cooldown system
✅ Adapts to Markets: ATR-based levels adjust to volatility
✅ Saves Time: All information in one clean dashboard
✅ Works Anywhere: Any market, any timeframe
✅ Stays Clean: No chart clutter, just actionable signals
Join thousands of traders who've upgraded their scalping game with the world's #1 scalper's methodology, refined into institutional-grade precision with retail-friendly execution.
⚠️ Important Disclaimers
Past performance does not guarantee future results
Trading involves substantial risk of loss
Test thoroughly on demo accounts first
Consider broker spreads in your calculations
Not financial advice - trade at your own risk
📈 Ready to Transform Your Trading?
Add The Elite One to your chart and experience the difference that professional-grade trading tools based on proven scalping methodology can make.
Remember: The best traders don't just follow signals—they understand their tools. Take time to learn the system, backtest thoroughly, and always trade responsibly.
Happy Trading! 🚀
The Elite One - Based on Fabio Valentini's #1 Scalper Methodology ⚡️
TrendIsYourFriend Strategy (SPY,IWM,VYM,XLK,SPXL,BTC,GOLD,VT...)Personal disclaimer
Don’t trust this strategy. Don’t trust any other model either just because of its author or a backtest curve. Overfitting is an easy trap, and beginners often fall into it. This script isn’t meant to impress you. It’s meant to survive reality. If it does, maybe it will raise questions and you’ll remember it.
Legal disclaimer
Educational purposes only. Not financial advice. Past performance is not indicative of future results.
Strategy description
Long-only, trend-based logic with two entry types (trend continuation or excess-move reversion), dynamic stop-losses, and a VIX filter to avoid turbulent markets.
Minimal number of parameters with enough trades to support robustness.
For backtest, each trade is sized at $10,000 flat (no compounding, to focus on raw model quality and the regularity of its results over time).
Fees = $0 (neutral choice, as brokers differ).
Slippage = $0, deliberate choice: most entries occur on higher timeframes, and some assets start their history on charts at very low prices, which would otherwise distort results.
What makes this script original
Beyond a classical trend calculation, both excess-move entries and dynamic stop-loss exits also rely on trend logic. Except for the VIX filter, everything comes from trend functions, with very few parameters.
Pre-configurations are fixed in the code, allowing sincere performance tracking across a dozen cases over the medium to long term.
Allowed
SPY (ARCA) — 2-hour chart: S&P 500 ETF, most liquid equity benchmark
IWM (ARCA) — Daily chart: Russell 2000 ETF, US small caps
VYM (ARCA) — Daily chart: Vanguard High Dividend Yield ETF
XLK (ARCA) — Daily chart: Technology Select Sector SPDR
SPXL (ARCA) — Daily chart: 3× leveraged S&P 500 ETF
BTCUSD (COINBASE) — 4-hour chart: Bitcoin vs USD
GOLD (TVC) — Daily chart: Gold spot price
VT (ARCA) — Daily chart: Vanguard Total World Stock ETF
PG (NYSE) — Daily chart: Procter & Gamble Co.
CQQQ (ARCA) — Daily chart: Invesco China Technology ETF
EWC (ARCA) — Daily chart: iShares MSCI Canada ETF
EWJ (ARCA) — Daily chart: iShares MSCI Japan ETF
How to use and form an opinion on it
Works only on the pairs above.
Feel free to modify the input parameters (slippage, fees, order size, margins, …) to see how the model behaves under your own conditions
Compare it with a simple Buy & Hold (requires an order size of 100% equity).
You may also want to look at its time-in-market — the share of time your capital is actually at risk.
Finally, let me INSIST on this : let it run live for months before forming an opinion!
Share your thoughts in the comments 🚀 if you’d like to discuss its live performance.

The Best Strategy Template[LuciTech]Hello Traders,
This is a powerful and flexible strategy template designed to help you create, backtest, and deploy your own custom trading strategies. This template is not a ready-to-use strategy but a framework that simplifies the development process by providing a wide range of pre-built features and functionalities.
What It Does
The LuciTech Strategy Template provides a robust foundation for building your own automated trading strategies. It includes a comprehensive set of features that are essential for any serious trading strategy, allowing you to focus on your unique trading logic without having to code everything from scratch.
Key Features
The LuciTech Strategy Template integrates several powerful features to enhance your strategy development:
•
Advanced Risk Management: This includes robust controls for defining your Risk Percentage per Trade, setting a precise Risk-to-Reward Ratio, and implementing an intelligent Breakeven Stop-Loss mechanism that automatically adjusts your stop to the entry price once a specified profit threshold is reached. These elements are crucial for capital preservation and consistent profitability.
•
Flexible Stop-Loss Options: The template offers adaptable stop-loss calculation methods, allowing you to choose between ATR-Based Stop-Loss, which dynamically adjusts to market volatility, and Candle-Based Stop-Loss, which uses structural price points from previous candles. This flexibility ensures the stop-loss strategy aligns with diverse trading styles.
•
Time-Based Filtering: Optimize your strategy's performance by restricting trading activity to specific hours of the day. This feature allows you to avoid unfavorable market conditions or focus on periods of higher liquidity and volatility relevant to your strategy.
•
Customizable Webhook Alerts: Stay informed with advanced notification capabilities. The template supports sending detailed webhook alerts in various JSON formats (Standard, Telegram, Concise Telegram) to external platforms, facilitating real-time monitoring and potential integration with automated trading systems.
•
Comprehensive Visual Customization: Enhance your analytical clarity with extensive visual options. You can customize the colors of entry, stop-loss, and take-profit lines, and effectively visualize market inefficiencies by displaying and customizing Fair Value Gap (FVG) boxes directly on your chart.
How It Does It
The LuciTech Strategy Template is meticulously crafted using Pine Script, TradingView's powerful and expressive programming language. The underlying architecture is designed for clarity and modularity, allowing for straightforward integration of your unique trading signals. At its core, the template operates by taking user-defined entry and exit conditions and then applying a sophisticated layer of risk management, position sizing, and trade execution logic.
For instance, when a longCondition or shortCondition is met, the template dynamically calculates the appropriate position size. This calculation is based on your specified risk_percent of equity and the stop_distance (the distance between your entry price and the calculated stop-loss level). This ensures that each trade adheres to your predefined risk parameters, a critical component of disciplined trading.
The flexibility in stop-loss calculation is achieved through a switch statement that evaluates the sl_type input. Whether you choose an ATR-based stop, which adapts to market volatility, or a candle-based stop, which uses structural price points, the template seamlessly integrates these methods. The ATR calculation itself is further refined by allowing various smoothing methods (RMA, SMA, EMA, WMA), providing granular control over how volatility is measured.
Time-based filtering is implemented by comparing the current bar's time with user-defined start_hour, start_minute, end_hour, and end_minute inputs. This allows the strategy to activate or deactivate trading during specific market sessions or periods of the day, a valuable tool for optimizing performance and avoiding unfavorable conditions.
Furthermore, the template incorporates advanced webhook alert functionality. When a trade is executed, a customizable JSON message is formatted based on your webhook_format selection (Standard, Telegram, or Concise Telegram) and sent via alert function. This enables seamless integration with external services for real-time notifications or even automated trade execution through third-party platforms.
Visual feedback is paramount for understanding strategy behavior. The template utilizes plot and fill functions to clearly display entry prices, stop-loss levels, and take-profit targets directly on the chart. Customizable colors for these elements, along with dedicated options for Fair Value Gap (FVG) boxes, enhance the visual analysis during backtesting and live trading, making it easier to interpret the strategy's actions.
How It's Original
The LuciTech Strategy Template distinguishes itself in the crowded landscape of TradingView scripts through its unique combination of integrated, advanced risk management features, highly flexible stop-loss methodologies, and sophisticated alerting capabilities, all within a user-friendly and modular framework. While many templates offer basic entry/exit signal integration, LuciTech goes several steps further by providing a robust, ready-to-use infrastructure for managing the entire trade lifecycle once a signal is generated.
Unlike templates that might require users to piece together various risk management components or code complex stop-loss logic from scratch, LuciTech offers these critical functionalities out-of-the-box. The inclusion of dynamic position sizing based on a user-defined risk percentage, a configurable risk-to-reward ratio, and an intelligent breakeven mechanism significantly elevates its utility. This comprehensive approach to capital preservation and profit targeting is a cornerstone of professional trading and is often overlooked or simplified in generic templates.
Furthermore, the template's provision for multiple stop-loss calculation types—ATR-based for volatility adaptation, and candle-based for structural support/resistance—demonstrates a deep understanding of diverse trading strategies. The underlying code for these calculations is already implemented, saving developers considerable time and effort. The subtle yet powerful inclusion of FVG (Fair Value Gap) related inputs also hints at advanced price action concepts, offering a sophisticated layer of analysis and execution that is not commonly found in general-purpose templates.
The advanced webhook alerting system, with its support for various JSON formats tailored for platforms like Telegram, showcases an originality in catering to the needs of modern, automated trading setups. This moves beyond simple TradingView pop-up alerts, enabling seamless integration with external systems for real-time trade monitoring and execution. This level of external connectivity and customizable data output is a significant differentiator.
In essence, the LuciTech Strategy Template is original not just in its individual features, but in how these features are cohesively integrated to form a powerful, opinionated, yet highly adaptable system. It empowers traders to focus their creative energy on developing their core entry/exit signals, confident that the underlying framework will handle the complexities of risk management, trade execution, and external communication with precision and flexibility. It's a comprehensive solution designed to accelerate the development of robust and professional trading strategies.
How to Modify the Logic to Apply Your Strategy
The LuciTech Strategy Template is designed with modularity in mind, making it exceptionally straightforward to integrate your unique trading strategy logic. The template provides a clear separation between the core strategy management (risk, position sizing, exits) and the entry signal generation. This allows you to easily plug in your own buy and sell conditions without altering the robust underlying framework.
Here’s a step-by-step guide on how to adapt the template to your specific trading strategy:
1.
Locate the Strategy Logic Section:
Open the Pine Script editor in TradingView and navigate to the section clearly marked with the comment //Strategy Logic Example:. This is where the template’s placeholder entry conditions (a simple moving average crossover) are defined.
2.
Define Your Custom Entry Conditions:
Within this section, you will find variables such as longCondition and shortCondition. These are boolean variables that determine when a long or short trade should be initiated. Replace the existing example logic with your own custom buy and sell conditions. Your conditions can be based on any combination of indicators, price action patterns, candlestick formations, or other market analysis techniques. For example, if your strategy involves a combination of RSI and MACD, you would define longCondition as (rsi > 50 and macd_line > signal_line) and shortCondition as (rsi < 50 and macd_line < signal_line).
3.
Leverage the Template’s Built-in Features:
Once your longCondition and shortCondition are defined, the rest of the template automatically takes over. The integrated risk management module will calculate the appropriate position size based on your Risk % input and the chosen Stop Loss Type. The Risk:Reward ratio will determine your take-profit levels, and the Breakeven at R feature will manage your stop-loss dynamically. The time filter (Use Time Filter) will ensure your trades only occur within your specified hours, and the webhook alerts will notify you of trade executions.

Nirvana True Duel전략 이름
열반의 진검승부 (영문: Nirvana True Duel)
컨셉과 철학
“열반의 진검승부”는 시장 소음은 무시하고, 확실할 때만 진입하는 전략입니다.
EMA 리본으로 추세 방향을 확인하고, 볼린저 밴드 수축/확장으로 변동성 돌파를 포착하며, OBV로 거래량 확인을 통해 가짜 돌파를 필터링합니다.
전략 로직
매수 조건 (롱)
20EMA > 50EMA (상승 추세)
밴드폭 수축 후 확장 시작
종가가 상단 밴드 돌파
OBV 상승 흐름 유지
매도 조건 (숏)
20EMA < 50EMA (하락 추세)
밴드폭 수축 후 확장 시작
종가가 하단 밴드 이탈
OBV 하락 흐름 유지
진입·청산
손절: ATR × 1.5 배수
익절: 손절폭의 1.5~2배에서 부분 청산
시간 청산: 설정한 최대 보유 봉수 초과 시 강제 청산
장점
✅ 추세·변동성·거래량 3중 필터 → 노이즈 최소화
✅ 백테스트·알람 지원 → 기계적 매매 가능
✅ 5분/15분 차트에 적합 → 단타/스윙 트레이딩 활용 가능
주의점
⚠ 횡보장에서는 신호가 적거나 실패 가능
⚠ 수수료·슬리피지 고려 필요
📜 Nirvana True Duel — Strategy Description (English)
Name:
Nirvana True Duel (a.k.a. Nirvana Cross)
Concept & Philosophy
The “Nirvana True Duel” strategy focuses on trading only meaningful breakouts and avoiding unnecessary noise.
Nirvana: A calm, patient state — waiting for the right opportunity without emotional trading.
True Duel: When the signal appears, enter decisively and let the market reveal the outcome.
In short: “Ignore market noise, trade only high-probability breakouts.”
🧩 Strategy Components
Trend Filter (EMA Ribbon): Stay aligned with the main market trend.
Volatility Squeeze (Bollinger Band): Detect volatility contraction & expansion to catch explosive moves early.
Volume Confirmation (OBV): Filter out false breakouts by confirming with volume flow.
⚔️ Entry & Exit Conditions
Long Setup:
20 EMA > 50 EMA (uptrend)
BB width breaks out from recent squeeze
Close > Upper Bollinger Band
OBV shows positive flow
Short Setup:
20 EMA < 50 EMA (downtrend)
BB width breaks out from recent squeeze
Close < Lower Bollinger Band
OBV shows negative flow
Risk Management:
Stop Loss: ATR × 1.5 below/above entry
Take Profit: 1.5–2× stop distance, partial take-profit allowed
Time Stop: Automatically closes after max bars held (e.g. 8h on 5m chart)
✅ Strengths
Triple Filtering: Trend + Volatility + Volume → fewer false signals
Mechanical & Backtestable: Ideal for objective trading & performance validation
Adaptable: Works well on Bitcoin, Nasdaq futures, and other high-volatility markets (5m/15m)
⚠️ Things to Note
Low signal frequency or higher failure rate in sideways/range markets
Commission & slippage should be factored in, especially on lower timeframes
ATR multiplier and R:R ratio should be optimized per asset

7Lots v27Lots strategy
The strategy is a counter-trend with a return to the moving average. Based on the DCA strategy, but greatly simplified to 7 lots (limit orders) and using the default martingale x2.5
Strategy description
Two moving averages are used. The first MA can be used as a filter for opening a position and also closing if the second MA is disabled. If both are enabled, then the position is closed by the second MA, and the first is used as a filter. There is also a separate take profit and if the price does not reach it, the position will be closed when returning to the MA, which will act as a stop loss, but the risk of liquidation is still present since the strategy does not have a regular classic stop loss.
Main parameters
TP & SL - selection of closing a position only by MA or take profit + MA. If only MA is selected, the strategy ignores the take profit value and always closes the position by MA.
MA settings
MA length from 1 to 200
Sliding type ALMA, SMA, EMA, VWMA, WMA, RMA
MA data - Open, High, Low, Close, HL2, HL3, OHLC4, OC2
MA shift in %. The MA shift is set in % above or below the current prices. For the First MA, this function allows you to use it as a filter for opening a position. For example, if you specify a shift much lower, for example -1% or -2%, then there will be less noise for opening a position, but this affects the number of transactions.
DCA group settings
Take profit %. Set the take profit as usual, but if the price does not reach the take profit, then the closing will occur by MA when the price returns to its values.
Take profit from. There is a choice of take profit from the average position, or by closing the previous bar. The latter increases the profit factor, but also increases the risk of liquidation if the strategy is used on perpetual contracts or futures.
Position Entry % - specifies the condition for opening a position. 0% - opening will occur immediately. 2% - opening will occur when the price falls 2% below the bar closing if the Long mode is set. If Short, then vice versa.
Grid Scale - classic progressive grid step
Next comes the setup of lots as a percentage of the deposit. Simply specify how many percent of each lot will be used from the total deposit. By default, a percentage for each lot is already allocated according to Martingale with a multiplier of x2.5, but you can calculate your own. You can specify 0, then the lot will be disabled.
Leverage. By default, 1.
Extra lot. This is the 7th lot that I decided to allocate separately from the main grid, since it is not always really needed. And it is calculated from the last lot of the grid. You can set it to how much lower percentage of the last lot to set it for and also what percentage of the deposit it will use. If you trade futures, then this lot, as an auxiliary one, can greatly average the position in case of strong volatility in the market.
Next, you can specify the start and end dates of transactions.
The table displays the total percentage of the deposit involved in trading at the moment. By default, all lots and leverage are set to 100% deposit load. The table also shows the number of transactions of the last 5-6 lots and extra, so that you can understand how many of them there were throughout the history of trading and possibly draw some conclusions for yourself. Especially useful for extra lots. Max Historical Drawdown (%) shows the historical price drop at the moment from the average open position. This will make it possible to analyze what leverage this strategy could withstand over the entire trading history. The date of this drop is also indicated.
For novice traders, it is recommended to use only on spot without the risk of liquidation. It is also best to use large time frames to see the whole picture, but you can also use a minute chart, there are no restrictions, everything is in your hands.
Tips. If you use minute charts, it is better to greatly increase the length of the MA from 20 and above. Hourly charts from 1-7. It is better to set up on spot and if you need futures, then use the same settings from spot, but with correction for futures. This strategy does not work well in Short, but shows excellent results for Long even when the market falls. When selecting settings, take into account sharp market fluctuations, Max Historical Drawdown (%) will show you this information in the table. You need to set up from the first MA, when you set up for the best result, then turn on the second MA and transfer the settings of the first MA to the second. Then fine-tune both MAs. The results can increase significantly, but this is not always the case. Sometimes just one MA is enough
The strategy is paid, tested with my own experience and money since 2022. Own development for opening a position.

SMC Breaker+Liquidity + HTF EMA — v61️⃣ Core Idea
This is a Smart Money Concept (SMC)
It looks for liquidity sweeps followed by price moving back in the opposite direction (breaker block behavior), while trading only in the direction of the higher timeframe (HTF) trend.
2️⃣ Components
A. Higher Timeframe EMA Bias
We take an EMA (default length: 50) from a higher timeframe (default: 4H).
If price is above that EMA → bias is bullish (we only take longs).
If price is below that EMA → bias is bearish (we only take shorts).
This keeps trades aligned with the bigger picture trend
B. Liquidity Sweep Detection
We find the highest high and lowest low over the past 5 bars
A sweep high happens when:
Price breaks above a recent high (liquidity grab), but
Closes back below it (false breakout).
A sweep low happens when:
Price breaks below a recent low, but
Closes back above it.
This indicates stop hunting — whales often trigger these before reversing price.
C. Breaker Block Logic
If a sweep low occurs and bias is bullish → BUY.
If a sweep high occurs and bias is bearish → SELL.
D. Optional ADX Filter
ADX checks market strength (trendiness).
If enabled, it only trades when ADX > threshold (default 20).
This avoids ranging/choppy markets.
3️⃣ Risk Management
Stop Loss (SL):
For longs → ATR(14) below the entry candle low.
For shorts → ATR(14) above the entry candle high.
Take Profit (TP):
SL distance × Risk:Reward ratio (default 3:1).
This means every win can be 3x bigger than a loss.

Dynamic DCA Envelope – Beta V1.1Dynamic DCA Envelope-Beta V1.1 is a preview version of a Dollar-Cost Averaging (DCA) strategy designed for trending or volatile markets.
-Long Positions Only
-Intended for Cryptocurrency, but can be used in any market
-1 and 4 hour timeframe
-Average Commissions 0.1%-0.3% per trade (Cryptocurrency)
What it does:
This strategy identifies buying opportunities when price closes below a dynamic envelope (based on EMA). After 3 consecutive closes below the lower envelope, the system arms a buy condition. A DCA buy-in is triggered when price bounces by a configurable percentage from the trailing low. The strategy supports up to 3 buy-ins, each equally sized, and closes the entire position at a fixed take profit or stop loss.
How it works:
-Entry logic is based on price deviation from an EMA envelope
-Waits for 3 closes below the envelope to detect weakness
-Uses bounce percentage from the lowest point to trigger each buy
-Includes cooldown logic between buys to avoid clustering
-All positions are closed when TP or SL is hit
How to use it:
-Use on trending assets with volatility (e.g., crypto, tech stocks)
-Adjust inputs to match asset behavior:
-EMA Length
-Envelope Offset %
-Bounce % (Trailing DCA)
-Take Profit / Stop Loss
-View strategy performance in the Strategy Tester tab
What’s unique:
Unlike most DCA scripts that immediately average down, this version includes:
-Trigger logic requiring multiple closes below trend
-Bounce-based entry to avoid catching a falling knife
-Cooldown resets to prevent overtrading
-A true entry–wait–buy–reset loop mimicking disciplined execution
*This is a beta version intended as a preview. A full Pro version is in development, which includes:
-SmartScaling logic
-Trailing take profit
-Multi-symbol scanning
-Backtest range limits
-Risk-adjusted filtering

Divergence Strategy [Trendoscope®]🎲 Overview
The Divergence Strategy is a sophisticated TradingView strategy that enhances the Divergence Screener by adding automated trade signal generation, risk management, and trade visualization. It leverages the screener’s robust divergence detection to identify bullish, bearish, regular, and hidden divergences, then executes trades with precise entry, stop-loss, and take-profit levels. Designed for traders seeking automated trading solutions, this strategy offers customizable trade parameters and visual feedback to optimize performance across various markets and timeframes.
For core divergence detection features, including oscillator options, trend detection methods, zigzag pivot analysis, and visualization, refer to the Divergence Screener documentation. This description focuses on the strategy-specific enhancements for automated trading and risk management.
🎲 Strategy Features
🎯Automated Trade Signal Generation
Trade Direction Control : Restrict trades to long-only or short-only to align with market bias or strategy goals, preventing conflicting orders.
Divergence Type Selection : Choose to trade regular divergences (bullish/bearish), hidden divergences, or both, targeting reversals or trend continuations.
Entry Type Options :
Cautious : Enters conservatively at pivot points and exits quickly to minimize risk exposure.
Confident : Enters aggressively at the latest price and holds longer to capture larger moves.
Mixed : Combines conservative entries with delayed exits for a balanced approach.
Market vs. Stop Orders: Opt for market orders for instant execution or stop orders for precise price entry.
🎯 Enhanced Risk Management
Risk/Reward Ratio : Define a risk-reward ratio (default: 2.0) to set profit targets relative to stop-loss levels, ensuring consistent trade sizing.
Bracket Orders : Trades include entry, stop-loss, and take-profit levels calculated from divergence pivot points, tailored to the entry type and risk-reward settings.
Stop-Loss Placement : Stops are strategically set (e.g., at recent pivot or last price point) based on entry type, balancing risk and trade validity.
Order Cancellation : Optionally cancel pending orders when a divergence is broken (e.g., price moves past the pivot in the wrong direction), reducing invalid trades. This feature is toggleable for flexibility.
🎯 Trade Visualization
Target and Stop Boxes : Displays take-profit (lime) and stop-loss (orange) levels as boxes on the price chart, extending 10 bars forward for clear visibility.
Dynamic Trade Updates : Trade visualizations are added, updated, or removed as trades are executed, canceled, or invalidated, ensuring accurate feedback.
Overlay Integration : Trade levels overlay the price chart, complementing the screener’s oscillator-based divergence lines and labels.
🎯 Strategy Default Configuration
Capital and Sizing : Set initial capital (default: $1,000,000) and position size (default: 20% of equity) for realistic backtesting.
Pyramiding : Allows up to 4 concurrent trades, enabling multiple divergence-based entries in trending markets.
Commission and Margin : Accounts for commission (default: 0.01%) and margin (100% for long/short) to reflect trading costs.
Performance Optimization : Processes up to 5,000 bars dynamically, balancing historical analysis and real-time execution.
🎲 Inputs and Configuration
🎯Trade Settings
Direction : Select Long or Short (default: Long).
Divergence : Trade Regular, Hidden, or Both divergence types (default: Both).
Entry/Exit Type : Choose Cautious, Confident, or Mixed (default: Cautious).
Risk/Reward : Set the risk-reward ratio for profit targets (default: 2.0).
Use Market Order : Enable market orders for immediate entry (default: false, uses limit orders).
Cancel On Break : Cancel pending orders when divergence is broken (default: true).
🎯Inherited Settings
The strategy inherits all inputs from the Divergence Screener, including:
Oscillator Settings : Oscillator type (e.g., RSI, CCI), length, and external oscillator option.
Trend Settings : Trend detection method (Zigzag, MA Difference, External), MA type, and length.
Zigzag Settings : Zigzag length (fixed repaint = true).
🎲 Entry/Exit Types for Divergence Scenarios
The Divergence Strategy offers three Entry/Exit Type options—Cautious, Confident, and Mixed—which determine how trades are entered and exited based on divergence pivot points. This section explains how these settings apply to different divergence scenarios, with placeholders for screenshots to illustrate each case.
The divergence pattern forms after 3 pivots. The stop and entry levels are formed on one of these levels based on Entry/Exit types.
🎯Bullish Divergence (Reversal)
A bullish divergence occurs when price forms a lower low, but the oscillator forms a higher low, signaling a potential upward reversal.
💎 Cautious:
Entry : At the pivot high point for a conservative entry.
Exit : Stop-loss at the last pivot point (previous low that is higher than the current pivot low); take-profit at risk-reward ratio. Canceled if price breaks below the pivot (if Cancel On Break is enabled).
Behavior : Enters after confirmation and exits quickly to limit downside risk.
💎Confident:
Entry : At the last pivot low, (previous low which is higher than the current pivot low) for an aggressive entry.
Exit : Stop-loss at recent pivot low, which is the lowest point; take-profit at risk-reward ratio. Canceled if price breaks below the pivot. (lazy exit)
Behavior : Enters early to capture trend continuation, holding longer for gains.
💎Mixed:
Entry : At the pivot high point (conservative).
Exit : Stop-loss at the recent pivot point that has resulted in lower low (lazy exit). Canceled if price breaks below the pivot.
Behavior : Balances entry caution with extended holding for trend continuation.
🎯Bearish Divergence (Reversal)
A bearish divergence occurs when price forms a higher high, but the oscillator forms a lower high, indicating a potential downward reversal.
💎Cautious:
Entry : At the pivot low point (lower high) for a conservative short entry.
Exit : Stop-loss at the previous pivot high point (previous high); take-profit at risk-reward ratio. Canceled if price breaks above the pivot (if Cancel On Break is enabled).
Behavior : Enters conservatively and exits quickly to minimize risk.
💎Confident:
Entry : At the last price point (previous high) for an aggressive short entry.
Exit : Stop-loss at the pivot point; take-profit at risk-reward ratio. Canceled if price breaks above the pivot.
Behavior : Enters early to maximize trend continuation, holding longer.
💎Mixed:
Entry : At the previous piot high point (conservative).
Exit : Stop-loss at the last price point (delayed exit). Canceled if price breaks above the pivot.
Behavior : Combines conservative entry with extended holding for downtrend gains.
🎯Bullish Hidden Divergence (Continuation)
A bullish hidden divergence occurs when price forms a higher low, but the oscillator forms a lower low, suggesting uptrend continuation. In case of Hidden bullish divergence, b]Entry is always on the previous pivot high (unless it is a market order)
💎Cautious:
Exit : Stop-loss at the recent pivot low point (higher than previous pivot low); take-profit at risk-reward ratio. Canceled if price breaks below the pivot (if Cancel On Break is enabled).
Behavior : Enters after confirmation and exits quickly to limit downside risk.
💎Confident:
Exit : Stop-loss at previous pivot low, which is the lowest point; take-profit at risk-reward ratio. Canceled if price breaks below the pivot. (lazy exit)
Behavior : Enters early to capture trend continuation, holding longer for gains.
🎯Bearish Hidden Divergence (Continuation)
A bearish hidden divergence occurs when price forms a lower high, but the oscillator forms a higher high, suggesting downtrend continuation. In case of Hidden Bearish divergence, b]Entry is always on the previous pivot low (unless it is a market order)
💎Cautious:
Exit : Stop-loss at the latest pivot high point (which is a lower high); take-profit at risk-reward ratio. Canceled if price breaks above the pivot (if Cancel On Break is enabled).
Behavior : Enters conservatively and exits quickly to minimize risk.
💎Confident/Mixed:
Exit : Stop-loss at the previous pivot high point; take-profit at risk-reward ratio. Canceled if price breaks above the pivot.
Behavior : Uses the late exit point to hold longer.
🎲 Usage Instructions
🎯Add to Chart:
Add the Divergence Strategy to your TradingView chart.
The oscillator and divergence signals appear in a separate pane, with trade levels (target/stop boxes) overlaid on the price chart.
🎯Configure Settings:
Adjust trade settings (direction, divergence type, entry type, risk-reward, market orders, cancel on break).
Modify inherited Divergence Screener settings (oscillator, trend method, zigzag length) as needed.
Enable/disable alerts for divergence notifications.
🎯Interpret Signals:
Long Trades: Triggered on bullish or bullish hidden divergences (if allowed), shown with green/lime lines and labels.
Short Trades: Triggered on bearish or bearish hidden divergences (if allowed), shown with red/orange lines and labels.
Monitor lime (target) and orange (stop) boxes for trade levels.
Review strategy performance metrics (e.g., profit/loss, win rate) in the strategy tester.
🎯Backtest and Optimize:
Use TradingView’s strategy tester to evaluate performance on historical data.
Fine-tune risk-reward, entry type, position sizing, and cancellation settings to suit your market and timeframe.
For questions, suggestions, or support, contact Trendoscope via TradingView or official support channels. Stay tuned for updates and enhancements to the Divergence Strategy!

Long Explosive V1The “Long Explosive V1” strategy calculates the percentage change in price from the last closing price of the candlestick, so that if it increases by a certain percentage it goes long, but if it decreases by another percentage it sends an exit order, so that the percentage limits above and below the current price function as inherent stop loss and take profit, with the benefit of taking advantage of the volatility of the bull market.
Entries and exits are always at the market and based on percentage changes in the price. Of course, the default configuration of the strategy considers a position with a 5% risk control, modest initial capital and standard commissions, which helps to obtain realistic results and protect the user from unexpectedly controlled potential losses.
It is again emphasized that it is always advisable to adjust the parameters of the strategy well, so that the risk-reward is well controlled.
